Wednesday, December 29, 2010

Molecule Sandbox


Are your children already tired of their Christmas toys and games? Or would you like to see them play with something less violent and more educational?

Vi Hart’s math doodle games can provide countless hours of fun. But another option that you may want to try is the Molecular Dynamics Applet that I created three years ago. It was originally intended for college students, but I soon discovered that small children love it.

The MD Applet is a sandbox for playing with atoms and molecules. Make up to a thousand atoms, large or small, in your favorite color. Watch them jiggle around endlessly, attracting and repelling their neighbors. Add energy to make liquid droplets boil; remove energy to make a gas condense and then freeze into a solid crystal. Start with an orderly arrangement and watch entropy increase. Connect atoms together with bonds, and even build simulated nano-scale machinery.

I don’t spend much time around small children, but Christmas is often an exception. This year I found myself entertaining (and being entertained by) a delightful seven-year-old who kept coming back, asking to play some more with the MD Applet. She asked her deepest question almost immediately: Why don’t they all just fall down and stop?

And in between molecular dynamics sessions, she learned how to draw stars with seven, eight, and even ten points!

Tuesday, December 21, 2010

Math Doodles

If you haven’t seen them already, you must watch Vi Hart’s fantastic math doodle videos on stars, squiggles, fractals, and infinite elephants. Browse the rest of her web site too, and be awe-struck at how accomplished she is at having fun.


I’m not much of a doodler, but Hart’s masterpieces reminded me of this modest Escheresque MacPaint doodle that I made soon after buying my first (original!) Macintosh computer in 1985. That was during my first year of grad school, when I should have been putting every effort into those problem sets on quantum mechanics, statistical mechanics, and solid state physics. Why are we most creative when we’re avoiding what we’re supposed to do?

(By the way, isn’t it cool that I can still open that MacPaint file in Preview? Thanks, Apple! Now please tell me how to open my old MacWrite files...)

Thanks to Charlie Trentelman for pointing me, via Facebook, to a blog post on Hart’s videos by NPR’s Robert Krulwich. And thanks to my old grad school friend Ned Gulley, whose venerable blog featured an entry last year about Hart’s Möbius music box. It’s become trendy to gripe about the Internet and Facebook, but this is the sort of thing I love about both.

Krulwich also quotes from Paul Lockhart’s magnificent tirade about math education, “A Mathematician’s Lament.” It’s not new, but I don’t think I’d ever seen it before. Read it and weep.

Sunday, October 10, 2010

Uncertainties in Science and Politics


Nate Silver is currently predicting that Republicans will gain 47 House seats in the upcoming election—plus or minus 30. In other words, he’s fairly sure that Republicans will gain between 17 and 77 seats, although there’s a slight chance the gain will be even less, or even more.

What good is a prediction when it carries such a wide margin of error? Answer: Far, far better than a prediction with no stated margin of error at all.

Understanding uncertainties, and learning to live with uncertainties, and stubbornly insisting on knowing the uncertainties, is the hallmark of a good scientist. A constant awareness of uncertainties may be the most important thinking pattern that distinguishes the two cultures (“techies” and “fuzzies”, we called them at Stanford) from each other.

If you study physics, we try to teach you about uncertainties through lab exercises. Suppose someone predicts that “g” (the acceleration of a freely flying projectile) should equal 9.8 meters per second squared. You measure its value and get 9.6. Have you confirmed the prediction or not? Yes, if the uncertainty in your measurement is at least 0.2. But if your uncertainly is only 0.02, you’ve disproved the prediction (and perhaps discovered a local gravitational anomaly).

Our introductory physics lab students think they’ll be graded on how close they get to the “right” answer, but they’re wrong. We actually grade them on whether they make a good uncertainty estimate, and on whether they interpret their results correctly in light of this uncertainty.

Perhaps I learned this lesson in undergraduate lab courses myself; I can’t remember. What I do remember, vividly, is my graduate school days at the Stanford Linear Accelerator Center, when I must have sat through hundreds of seminars on experimental results and their theoretical interpretation. Each speaker would spend a major portion of the talk meticulously explaining how the uncertainties had been estimated. Most of the after-talk discussion would center on whether these estimates were accurate and whether the speaker had, given the uncertainties, drawn the right conclusion. In elementary particle physics, where the experiments cost hundreds of millions of dollars and the data are inherently statistical, you had better interpret your results correctly.

But uncertainties don’t play well in politics. Whenever a climatologist admits that there’s any uncertainty at all in the predicted rise in earth’s average temperature, global warming deniers loudly yell “See! The scientists admit they don’t know what will happen!” Or to take another example from the not-so-distant past: Imagine that President Bush had said in 2002 that he actually wasn’t sure whether Iraq was developing weapons of mass destruction, but there seemed to be a 50/50 chance of it. Would Congress still have authorized the war?

Nate Silver is a hero (and an anomaly) because he’s able to look at all the data, make his best prediction, and still be honest about his uncertainties—even when the subject is politics.

I’ll end (once again) with a local political example. A respected economic consultant recently predicted that the middle segment of Ogden’s proposed streetcar system will stimulate $8.5 million of investment if it follows one proposed alignment, but only $1.5 million if it follows an alternate alignment. Ten days ago I asked her what the uncertainty range is on those numbers, and she replied, “Well, you can see that we rounded them to the nearest half million.” I’m afraid I laughed at that point, and tried unsuccessfully to convince her that the uncertainties were many times larger. I knew the numbers had been calculated from property value assessments, and that these assessments can be systematically off by 50% or even more. Worse, I knew that the lists of properties to be included in the calculations had been compiled through a subjective, undocumented process. After our conversation I looked up some of the property assessments and quickly saw that you could increase the $1.5 million prediction to over $9 million by excluding just two properties (out of several dozen) from the list. A fair estimate of the uncertainty would be much higher still.

But economic consultants apparently aren’t in the habit of thinking about uncertainty. Undoubtedly this is because their clients don’t want to hear about it; they just want simple answers. In this case the client was the Utah Transit Authority—a government agency that supposedly represents the people. Ultimately, it is the citizens at large who need to learn to think like scientists.

Wednesday, September 1, 2010

The Fight Over NASA Continues

The fight in Washington over NASA’s future has gotten complicated and ugly, like any other legislative battle. I can’t keep up with the details, but the latest development is noteworthy.

The voices of reason have just sent an open letter to the chairman of the House Committee on Science and Technology, pleading for more support for new technology, commercial spaceflight, robotic precursor missions, and student research. These are some of the programs that our government has been scaling back in recent years, and may continue to scale back, in order to divert every available dollar to the entrenched Constellation Program contractors.

The letter is signed by 14 Nobel laureates and a list of eminent former NASA officials and astronauts. Will anyone listen to them? I have no idea.

Meanwhile, our local entrenched contractor test-fired a rocket motor yesterday, resulting in yet another article (and yet another cool photo) in the local paper. Of course, the article reminds us yet again of how many local jobs hang in the balance as Congress debates NASA’s future. And what is the purpose of this new rocket motor? All we’re told is this: “ATK hopes its motor will boost a rocket into low Earth orbit, or maybe space.”

Sunday, August 22, 2010

Textbook Prices


Today, on the eve of the start of fall semester classes, Mark Saal’s column in the Ogden Standard-Examiner appropriately takes aim at astronomical textbook prices. And although many of his examples are books for economics courses, he also lists the price of an introductory astronomy textbook!

(Feynman joke: “There are 1011 stars in the galaxy. That used to be a huge number. But it’s only a hundred billion. It’s less than the national deficit! We used to call them astronomical numbers. Now we should call them economical numbers.”)

As Saal points out, high college textbook prices are mainly due to the fact that the people choosing the books (the professors) are never the same ones who are paying for the books (the students). Publishers bombard professors with free copies of textbooks and in fact, I doubt that most professors even know what their assigned books cost. (The sales reps certainly don’t volunteer this information.) Under this system, textbook prices have been creeping upward considerably faster than inflation for the last 25 years.

One force that tries to counteract this trend is the used book market. Students have been selling their used books to each other for a very long time. College bookstores take an “if you can’t beat ’em, join ’em” attitude, buying back used books for half price and then reselling them at 75% of the price of a new book. (The difference, 25% of the new price, happens to be the same as the bookstores’ profit margin on new books.) Students who don’t wish to keep their books can save a lot of money under this system, buying a used book for 75% of the new price and then selling it back at 50%, for a net cost of only 25%. Students who want to keep their books, though, still pay 75% of the new price.

Fighting back, publishers do everything they can to suppress the used book market. Mass-produced introductory books are now revised every three or four years, thereby making all used copies of the previous edition worthless. The revisions rarely add anything of value to the content. If publishers could revise books even more often, I’m sure they would—but that’s pretty much impossible. So they now publish most books in paperback, designed to self-destruct after a semester of use (while saving almost nothing in production cost). Another trick is to shrink-wrap a single-use student workbook with the main book, hoping that professors will require their students to have both. More recently, publishers have started providing online extras such as self-grading homework assignments, protected by a password that students have to pay for unless they buy a new book. The password expires after a year, and cannot be transferred to another student.

Being the half-assed crusader that I am, I’ve been fighting this system, in my own small ways, since 1990. I’ve written angry letters to publishers, posted a web article documenting the alarming trend in prices, and even made my own publisher put a clause in our contract to limit the price of my thermal physics textbook. I’ve never required my students to use the shrink-wrapped workbooks or online homework systems. For my own astronomy section, I’ve started writing a free online text (emphasis on started).

But of all the ways that professors can save money for their students, the most promising by far is simply this: Turn the publishers’ tactic against them and let your students use an earlier edition of the book. College bookstores won’t stock superseded editions, because they can’t be returned to the warehouse if they don’t sell. But the Internet makes it extremely easy for students to obtain used older editions, and the prices are rock-bottom.

Wednesday, July 28, 2010

History’s Greatest Star Map


Next time you’re out under a clear, dark sky at night, look up and pick out a star at random. Chances are, nobody knew until 15 years ago how far away that star is. Now, thanks to the European Space Agency’s Hipparcos mission, we know.

Your randomly chosen star is probably somewhere between 100 and 1000 light-years away, although there’s about a 15% chance that it’s closer, and about a 10% chance that it’s farther. If your star is one of that nearest 15%, then its distance was probably known, to an accuracy of 50% or better, before Hipparcos. Otherwise, astronomers could have given you no better than a rough estimate of your star’s distance.

Direct measurements of star distances come from the method of triangulation, or parallax: Look at the star from two different directions, and measure its angular shift as you switch viewing locations. It’s the same principle as two-eyed vision, except that in the case of stars, the two viewing locations are on opposite sides of earth’s orbit around the sun—300 million kilometers apart.

Despite this enormous baseline, the angular shifts are miniscule, even for the nearest stars. And for stars beyond 100 light-years, the angles are too small to measure with any accuracy through earth’s blurry atmosphere. So in 1989 the ESA launched the Hipparcos satellite, carrying a special-purpose telescope dedicated to making accurate measurements of the positions of 100,000 stars. By repeating the measurements over a three-year period, the instrument determined not only the parallax shifts but also the steady motions of the stars as they gradually drift across our galaxy. The catalog of results, published in 1997, gives accurate distances and motions for all but a handful of the naked-eye stars, and many, many more.

You can now read about the Hipparcos mission in a new book by Michael Perryman: The Making of History’s Greatest Star Map. Perryman was Coordinating Scientist for the Hipparcos mission, and he does a masterful job at conveying what an immense undertaking it was. Hundreds of scientists spent many years of their careers on Hipparcos, while some of Europe’s most advanced industries fabricated the satellite and its unique optical system. The story also includes high drama, thanks to the failure of the booster rocket that was to put the satellite into its final orbit. That the scientists were able to recover from this disaster and still surpass all the mission’s goals was nothing short of miraculous.

Unfortunately, Perryman’s book has several shortcomings. He tries to do too much, telling not only the story of the Hipparcos mission but also the whole history of astronomy since ancient times—in fewer than 300 pages. Indeed, the main intent of this book is apparently to establish the place of Hipparcos in history, and to properly credit several dozen of the principal scientists for their respective roles. Educating the reader is secondary, and although the book tries to be accessible to non-astronomers (and to wow them with vague superlatives), I fear that most would be overwhelmed by the enormous number of technical details so superficially explained. I learned quite a bit from the book, but I’m already a professional physicist who teaches introductory astronomy. For my own part, I was disappointed that the book didn’t adequately explain how the Hipparcos optical system worked, or even point to a reference where I could learn more. I still have no idea why the system’s limiting resolution was about a thousandth of an arc-second, or how this relates to the diameter of its main mirror (30 centimeters).

Still, the inadequacies of the book shouldn’t detract from the importance of the Hipparcos mission. Virtually every subfield of astronomy now rests upon a firmer foundation, thanks to Hipparcos.

As an American, I can’t help but notice the differences between Hipparcos and the many equally impressive science missions carried out by NASA. Hipparcos produced no pretty pictures, and made no sudden discoveries. You can’t convey its importance in a ten-second sound-bite. It was designed, built, launched, operated, and funded by people who were focused not on short-term payoffs but on the long-term advancement of science. Such a mission would never have been supported by NASA, an agency that is forced to put glamor ahead of science because its budget is continually threatened by the whims of politicians. Of course, an advantage of the American system is that NASA has become very good at making its results accessible to the general public.

Ironically, it may not be long before the importance of the Hipparcos mission is merely historical. Encouraged by its success and the progress of technology over the last two decades, the ESA is now preparing a successor mission called Gaia, scheduled for launch in late 2012. If all goes as planned, Gaia will measure the positions of a billion stars, with an accuracy a hundred times greater than that of Hipparcos. Its completed three-dimensional star map will stretch across most of the Milky Way galaxy, far beyond the most distant naked-eye stars. Gaia will also discover thousands of planets orbiting distant stars, as well as tens of thousands of asteroids within our solar system. It will gather data over a period of five years, and its results will be published by 2020.

Saturday, July 24, 2010

How to Photograph the Milky Way


This summer I’ve been making quite a few wide-angle astronomical photos, especially of the Milky Way. Here are links to a collection of photos taken in June in the San Rafael Swell, and some other miscellaneous astronomical photos.

When I show these photos to people, they often ask how to make similar photos themselves. Here’s a summary of what I’ve figured out so far. For much more advice on astrophotography, I highly recommend Jerry Lodriguss’s site.

To photograph the Milky Way, you need the following:
  • A camera. I use Canon’s cheapest digital SLR, the Rebel XS (street price $500). Any other DSLR will probably work fine, except perhaps some of the earliest models which have higher noise levels. There may now be some high-end point-and-shoot cameras that will give acceptable results, but I’m not sure of this; most point-and-shoot cameras can’t take long enough exposures, and even if they could, the noise levels would be unacceptable. Film cameras don’t work well because even the fastest readily available films aren’t as sensitive to dim light as the sensor in a DSLR.
  • A wide-angle lens. I’ve invested in a Sigma 20mm f1.8 lens ($520), although the inexpensive 18-55mm zoom lens that came with my camera was good enough to get started. If money is no object, get the Canon 24mm f1.4 ($1700), along with a full-frame Canon 5D ($2500); that’s what the pros seem to use, as far as I can tell.
  • A tripod. I got a perfectly usable one at a discount store for $29.
  • A dark site. This is the most difficult part for many people. You cannot make decent photos of the Milky Way from a light-polluted city. But here in Utah, there are some very dark sites within a one-hour drive of my urban home. Depending on where you live, you may need to travel farther.
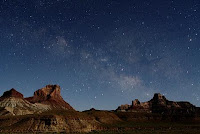
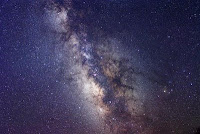
Of course, you also need a clear sky with a view of the Milky Way. From the northern hemisphere, the best views of the Milky Way are in the summer, with the brightest parts in the southern sky.

Before heading out on a dark night, practice with the settings on your camera. Put it in fully manual mode, including manual focus. Set it for a 30-second exposure at ISO 1600, with the lens at its widest aperture (perhaps f3.5 on a zoom lens). Practice turning the display on and off, and turn its brightness down. Set the camera to store images in “raw” format, rather than jpeg. Most importantly, figure out how to manually focus the lens at infinity. Some lenses are conveniently labeled for focusing, but my zoom lens isn’t, so I had to mark the infinity setting (when zoomed out to 18mm) with white tape.

With this preparation, taking the photos should be pretty easy. Turn the display off when you’re pointing the camera (so it doesn’t ruin your eyes’ dark adaptation), then turn it back on to check the settings (30 seconds, ISO 1600, widest aperture) and fire away. It’s hard to compose a photo in the dark, but you can review the composition on the LCD and try again as needed.

After downloading the photos to your computer, use the software that came with the camera to adjust the brightness, contrast, and color balance. With “raw” images you can make some pretty dramatic adjustments without losing quality.

Speaking of quality, there are three factors that limit the amount of detail in a photo of this type:
  1. Digital noise, which gets worse at higher ISO settings;
  2. Lens aberrations, which blur and dim the edges of the image, and which get worse when the lens is opened to a wide aperture (low focal ratio);
  3. The earth’s spinning motion, which turns star images into trails and blurs the Milky Way over time. (In 30 seconds the earth turns by 1/8 of a degree.)
To lessen any one of these problems, you generally need to worsen one of the others. The trick is to make sure that no one of them is much worse than the other two. By all means, experiment with different ISO settings, apertures, and exposure times. I always stop-down my Sigma lens to about f2.8 to reduce aberrations, but stopping-down may not be an option if you’re using a relatively slow zoom lens. I’m happy with ISO 1600, which is the highest setting on my camera. Most of the digital noise disappears when I reduce the photos to screen size, but in long exposures there are always some “hot pixels” which can be manually fixed in Photoshop if necessary.

Even with the most expensive equipment, photos made in this way will not be sharp enough to withstand poster-size enlargements. For example, I’m a big fan of Wally Pacholka’s photos, and I have a framed 36-inch panorama of his in my living room, but it doesn’t show much more detail at that size than in the screen version on his web site.

It’s a nice touch to include foreground scenery in your photos, but if you want more than silhouettes, you’ll need to plan carefully. A small amount of artificial light, from ambient light pollution or even a flashlight, can sometimes illuminate the scenery without ruining the Milky Way. Moonlight is another option, but anything bigger than a crescent moon will brighten the sky too much for a good Milky Way photo, and there are only a few nights each month, and a few hours each of these nights, when the crescent moon is above the horizon after dark. Even then, the moonlight won’t always be shining in the direction you want.


If you don’t want to include foreground scenery in your photos, then life becomes much easier. You can try using a tracking mount to compensate for the earth’s rotation, allowing much longer exposure times. Then you can use a smaller aperture and/or lower ISO setting to reduce problems 1 and 2 above. You can even use a film camera, which is far less expensive but requires additional skills and patience.