Showing posts with label Astronomy. Show all posts

Monday, September 12, 2016

A Year of Solar Data

My solar panels were installed in August of last year, and two months later I reported on how they were performing. Now, after a full year of operation, it’s time for a more comprehensive report.

The bottom line is that the panels produced a little less electrical energy than the installer predicted, but still quite a bit more than I used over the course of the year. Here’s a diagram showing the overall energy flows:


Here and throughout this article I’ll present data from the year that began on 1 September 2015 and ended on 31 August 2016. During that time the panels produced 1558 kilowatt-hours (kWh) of electrical energy, and I used 349 kWh of that energy directly. The other 1209 kWh went onto the grid for my neighbors to use. But I also pulled 813 kWh of energy off the grid, at night and at other times when I needed more power than the panels were producing. My total home usage from both the panels and the grid was 1162 kWh. (I got the solar production amount from my Enphase solar monitoring system, and the amounts going to and from the grid by reading my electric meter. From these three numbers I calculated the other two.)

Because I used less energy than my panels produced, I’ve paid no usage charges on my electric bills since the system was installed; I pay only the monthly minimum charges, which come to about $9.00 per month including taxes. Under Utah’s net-metering policy (which could change in the future), each kWh that I push onto the grid can offset the cost of a kWh that I pull off of the grid at some other time. But I don’t get to make a profit from the 396 kWh excess that I pushed onto the grid over the course of the year; that was effectively a donation to Rocky Mountain Power, worth about $40 at retail rates.

Monthly and daily details

So much for the yearly totals. But the picture varies quite a bit with the seasons, as shown in this graph of my panels’ monthly output:


The total energy generated in July (165 kWh) was twice as much as in January (81 kWh), with a pretty steady seasonal rise and fall in between. On the other hand, my installer estimated significantly higher production in winter and spring, plotted on the graph as green squares. (I get a similar over-estimate of the winter and spring production, relative to summer and fall, when I use the NREL PVWatts calculator, with weather data from the Ogden airport. So maybe my location is cloudier than the airport, and/or maybe last winter was cloudier than the 30-year average that the calculator uses.) The actual annual production of 1558 kWh was 91% of the estimated total of 1713 kWh. (An earlier, less formal estimate from the installer was 1657 kWh for the year, and not broken down by month; my annual production was 94% of that estimate.)

You might think the factor-of-2 seasonal variation in my solar energy production was a direct result of the varying length of the days and/or the varying solar angles. In fact, however, it was mostly due to varying amounts of cloud cover. You can see this in a plot of the daily energy generated:


The energy output on sunny days varied only a little with the seasons, and was actually lowest in the summer. But summer days in northern Utah are consistently sunny, whereas a full day of sunshine can be uncommon in mid-winter. Incidentally, my best day of all was February 23 (6.7 kWh), while my worst day was January 30 (0.0 kWh, because it snowed throughout the day).

Although the seasonal variations among sunny days are relatively small, they’re still interesting. The output drops off in mid-winter because the days are shorter, and also because the mountains block the early morning sunlight. On the other hand, the output drops off in the summer because of the steep angle of my roof. The panels face the noon sun almost directly throughout the fall and winter, but they face about 37 degrees too low for the mid-summer noon sun, reducing the amount of solar power they receive by about 20% (because the cosine of 37° is 0.8). The following plot shows all these effects:


Notice that the vertical axis on this plot is power, or the rate of energy production. To get the total energy generated you need to multiply the power by the time elapsed, which is equivalent to calculating the area under the graph. As you can see, the June graph is lowest at mid-day but extends farther into the early morning and late afternoon, while the December graph is highest but narrowest. The total energy (area) is largest for the March graph. The asymmetry in the December graph, and in the lowest part of the March graph, is from the mountains blocking the rising sun. The smooth “shoulders” on either side come from the shadow of the pointy gable in the middle of my roof.

With all of these effects in mind, as well as the day-to-day variations in cloud cover, let me now show all of my solar data for the year in a single image. Here the day of the year is plotted from top to bottom, and the time of day from left to right. The power level in watts is represented by color, with brighter colors indicating higher power levels:


In the upper-left portion of this image you can more or less see the shape of the mountains, with a reflection at the winter solstice. The dark stripes are cloudy days, with the exception of a power outage during the wind storm of May 1 (that’s right—a standard grid-connected photovoltaic system produces no power when the grid goes out). Subtle astronomical effects cause some further asymmetries from which, with enough analysis, you could probably extract the shape of the analemma.

Details aside, the big picture is that the steepness of my roof is almost ideal for the winter months. It even ensures that snow slides off the panels as soon as the sun comes out. But the steep angle hurts my solar production more in the summer than it helps in the winter, mostly because so many winter days are cloudy anyway.


Effect of temperature

Looking back at the previous graph for the three sunny days in different seasons, you might have noticed that the noon power level drops from winter to summer by more than the 20% predicted by the solar geometry. The discrepancy on any particular day could be due to variable amounts of haze, but there’s another important effect: temperature.

To isolate the effect of temperature, I took the noon power level for every day of the year and divided it by the (approximate) cosine-theta geometrical factor to get what the power would have been if the panels were directly facing the sun. Then I plotted this adjusted power level vs. the ambient temperature (obtained from Ogden-area weather reports) to get the following graph:


The data points cluster along a line or curve with a negative slope, confirming that the panels produce less power at higher temperatures. Very roughly, it appears that the power output is about 15% less at 90°F than at 20°F. For comparison, the data sheet for the solar panels indicates that the power should drop by 0.43% for each temperature increase of 1 degree Celsius, or about 17% for an increase of 70°F. But this specification is in terms of the temperature of the panels, which I wouldn’t expect to vary by the same amount as the ambient temperature.

(In the preceding plot, the outlying data points below the cluster are from days when clouds reduced the solar intensity; most such points lie below the range shown in the graph. I’m pretty sure that the outliers above the cluster are from partly cloudy days when the panels were getting both direct sunlight and some reflected light from nearby clouds.)

Electricity usage

Now let’s look at the seasonal variation in my home electricity usage, compared to the solar panels’ output. Here’s a graph of the monthly data, with the solar data now plotted as blue squares and the usage plotted as columns, divided into direct-from-solar usage and from-the-grid usage:


Unfortunately, my electrical usage peaks in mid-winter, when the solar production is at a minimum! But even during the bulk of the year when the solar production exceeds my total use, well over half of the electricity I use comes off the grid, not off the panels.

The good news is that I’ve actually reduced my total electricity use by about 15% since the panels were installed. I did this through several small changes: running the furnace less when I was away from home; cooling my house in the summer with a super-efficient whole house fan instead of smaller fans sitting in windows; and unplugging an old computer and a portable “boom box” stereo that were drawing a few watts even when turned off. I’m still using more electricity than I did a decade ago, when I had no home internet service and no hard-wired smoke detectors. But if you look just at what I’m using off the grid, it’s slightly lower even than back in those simpler times. Here’s an updated plot of my average daily usage during every month since I bought my house 18 years ago (as explained more fully in this article from last year):


What would it take to live off the grid?

I’ve repeatedly emphasized the electrical energy that I continue to draw from the grid, because I want readers to understand that virtually all of the solar panels being installed these days are part of the electrical grid—not an alternative to it. Even though my panels generate more electrical energy than I use over the course of a year, they will not function without a grid connection and of course they generate no power at all during most of the times when I need it.

But what would it take to live off the grid entirely? The most common approach is to combine an array of solar panels with a bank of batteries, which store energy for later use when the sun isn’t shining. For example, there’s been a lot of talk recently about the new Tesla Powerwall battery, which stores 6.4 kWh of energy—enough to power my home for about two days of average use. A Tesla Powerwall sells for $3000, which is somewhat more than the net cost (after tax credits) of my solar panels. If I were to make that further investment, could I cut the cord and live off the grid?

To answer this question, I combined my daily solar generation data with a data set of nightly readings of my electric meter. (The latter data set is imperfect due to inconsistent reading times, missed readings when I was away, and round-off errors, but day-to-day errors cancel out over longer time periods so it should give the right picture overall.) I then calculated what the charge level of my hypothetical Tesla Powerwall would be at around sunset on each day, and plotted the result:


For most of the year the battery would hold more than enough energy to get through the nights, but in this simulation there were 42 evenings in the late fall and winter when the level dropped to zero, and several more evenings when it dropped low enough that it would surely be empty by morning. Simply getting a Tesla Powerwall is not enough to enable me, or most other households with solar panels, to disconnect from the grid.

What if I added a second Tesla battery? Unfortunately, that would reduce the number of zero-charge nights by only eight, from 42 to 34. In fact, it would take thirteen Tesla batteries, in this simulation, to completely eliminate zero-charge nights, because there is a period of a few weeks during mid-winter when the average output of my solar panels is barely over half what I’m using.

The better solution, therefore, would be to add more solar panels. For example, if I were to double the size of my solar array and install two Tesla Powerwalls, then the simulation predicts that I would run out of electricity just one night during the year. Of course this scenario is still extremely wasteful, because I’d be using less than half the capacity of the panels and only a small fraction of the capacity of the batteries during most of the year. That’s why people who actually live off the grid tend to have backup generators that run on chemical fuels, and don’t rely on electricity for most of their heating or cooking.

Similar calculations would apply to our society as a whole. A massive investment in both solar panels and batteries could conceivably get us to the point where most of our electricity, for most of the year, is coming from the sun. But it will never be economical to get that “most” up to 100%, because so much over-building would be needed to get through periods of cloudy weather, and it will be much less expensive to use other energy sources at those times.

Thursday, September 22, 2011

Supernova!

Thanks to some prodding from my astronomy students, I've now seen my first supernova. Practiced finding it two nights in a row, then invited students and friends for a supernova party up in the mountains last night. Most worthwhile.

Oddly, I couldn't find a good image online that showed what it actually looks like through the eyepiece of a small telescope. (By small, I mean my 10-inch Newtonian reflector, or the 6-inch reflector that one of my students brought last night.) Most of the photos online are exposed to bring out lots of detail in the Pinwheel Galaxy, de-emphasizing the supernova itself.

So in an attempt to help others who are looking for it, I just whipped up this simulated image using Stellarium and Photoshop (click for a larger version):


The circle shows a 1.5 degree field of view, which is typical for a small reflector using a low-power eyepiece. The smudge in the center (which is actually much fainter than shown here, even from a very dark site) is the galaxy. Look for it with averted vision. The point of light closest to the center of the smudge, oriented at about two o'clock in the image, is the supernova. This is the orientation you'll see in a Newtonian reflector eyepiece at the best viewing time, soon after dark.

Other web sites, like this one, can help you point your telescope to the right part of the sky.

The supernova is already starting to fade, so hurry and look while you can!

Wednesday, July 6, 2011

The Space Shuttle: Inspiration or Distraction?


The news sites are devoting quite a bit of space to this Friday’s final launch of the Shuttle. Perhaps the best discussion I’ve seen is Dennis Overbye’s essay in the New York Times.

The Salt Lake Tribune, understandably, is covering the story from more of a local perspective, emphasizing the Utah jobs and educational opportunities that have depended on the Shuttle over the years.

One of the quotes in the Tribune, though, was over the top. A Utah State University student, whose research has been tied to the shuttle program, said the following:
“Without having a space shuttle or have something that America can send Americans up in, we don’t have anything that can inspire the next generation. I’ve been watching a lot about the Apollo program, and it was awesome that we could build that and then the space shuttle. But now, we have nothing.”
Upon reading this, I left a comment suggesting that this student become just a tad more open-minded about what he considers inspiring. And as an example, I picked NASA’s most important scientific mission: the James Webb Space Telescope (JWST).


Most Americans have never heard of the JWST, because no humans will be flying on the rocket that launches it. But it will be an immensely powerful instrument, probing the early stages of the formation of planets and galaxies, peering billions of years back in time. Anyone who can think for even ten seconds should find that far more inspiring than a publicly funded billion-dollar amusement park ride, only a couple hundred miles above earth’s surface, repeated 135 times.

Then, a few hours later, I saw something on Cosmic Variance about the JWST now being in jeopardy. I won’t try to defend the cost overruns and mismanagement, which are rightly being compared to the SSC. But if JWST gets canceled it will be a genuine tragedy for this generation and the next.

I’ll be watching to see if the Utah newspapers even cover the story.

Wednesday, July 28, 2010

History’s Greatest Star Map


Next time you’re out under a clear, dark sky at night, look up and pick out a star at random. Chances are, nobody knew until 15 years ago how far away that star is. Now, thanks to the European Space Agency’s Hipparcos mission, we know.

Your randomly chosen star is probably somewhere between 100 and 1000 light-years away, although there’s about a 15% chance that it’s closer, and about a 10% chance that it’s farther. If your star is one of that nearest 15%, then its distance was probably known, to an accuracy of 50% or better, before Hipparcos. Otherwise, astronomers could have given you no better than a rough estimate of your star’s distance.

Direct measurements of star distances come from the method of triangulation, or parallax: Look at the star from two different directions, and measure its angular shift as you switch viewing locations. It’s the same principle as two-eyed vision, except that in the case of stars, the two viewing locations are on opposite sides of earth’s orbit around the sun—300 million kilometers apart.

Despite this enormous baseline, the angular shifts are miniscule, even for the nearest stars. And for stars beyond 100 light-years, the angles are too small to measure with any accuracy through earth’s blurry atmosphere. So in 1989 the ESA launched the Hipparcos satellite, carrying a special-purpose telescope dedicated to making accurate measurements of the positions of 100,000 stars. By repeating the measurements over a three-year period, the instrument determined not only the parallax shifts but also the steady motions of the stars as they gradually drift across our galaxy. The catalog of results, published in 1997, gives accurate distances and motions for all but a handful of the naked-eye stars, and many, many more.

You can now read about the Hipparcos mission in a new book by Michael Perryman: The Making of History’s Greatest Star Map. Perryman was Coordinating Scientist for the Hipparcos mission, and he does a masterful job at conveying what an immense undertaking it was. Hundreds of scientists spent many years of their careers on Hipparcos, while some of Europe’s most advanced industries fabricated the satellite and its unique optical system. The story also includes high drama, thanks to the failure of the booster rocket that was to put the satellite into its final orbit. That the scientists were able to recover from this disaster and still surpass all the mission’s goals was nothing short of miraculous.

Unfortunately, Perryman’s book has several shortcomings. He tries to do too much, telling not only the story of the Hipparcos mission but also the whole history of astronomy since ancient times—in fewer than 300 pages. Indeed, the main intent of this book is apparently to establish the place of Hipparcos in history, and to properly credit several dozen of the principal scientists for their respective roles. Educating the reader is secondary, and although the book tries to be accessible to non-astronomers (and to wow them with vague superlatives), I fear that most would be overwhelmed by the enormous number of technical details so superficially explained. I learned quite a bit from the book, but I’m already a professional physicist who teaches introductory astronomy. For my own part, I was disappointed that the book didn’t adequately explain how the Hipparcos optical system worked, or even point to a reference where I could learn more. I still have no idea why the system’s limiting resolution was about a thousandth of an arc-second, or how this relates to the diameter of its main mirror (30 centimeters).

Still, the inadequacies of the book shouldn’t detract from the importance of the Hipparcos mission. Virtually every subfield of astronomy now rests upon a firmer foundation, thanks to Hipparcos.

As an American, I can’t help but notice the differences between Hipparcos and the many equally impressive science missions carried out by NASA. Hipparcos produced no pretty pictures, and made no sudden discoveries. You can’t convey its importance in a ten-second sound-bite. It was designed, built, launched, operated, and funded by people who were focused not on short-term payoffs but on the long-term advancement of science. Such a mission would never have been supported by NASA, an agency that is forced to put glamor ahead of science because its budget is continually threatened by the whims of politicians. Of course, an advantage of the American system is that NASA has become very good at making its results accessible to the general public.

Ironically, it may not be long before the importance of the Hipparcos mission is merely historical. Encouraged by its success and the progress of technology over the last two decades, the ESA is now preparing a successor mission called Gaia, scheduled for launch in late 2012. If all goes as planned, Gaia will measure the positions of a billion stars, with an accuracy a hundred times greater than that of Hipparcos. Its completed three-dimensional star map will stretch across most of the Milky Way galaxy, far beyond the most distant naked-eye stars. Gaia will also discover thousands of planets orbiting distant stars, as well as tens of thousands of asteroids within our solar system. It will gather data over a period of five years, and its results will be published by 2020.

Saturday, July 24, 2010

How to Photograph the Milky Way


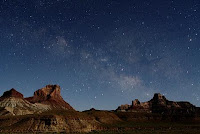
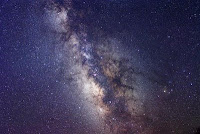
This summer I’ve been making quite a few wide-angle astronomical photos, especially of the Milky Way. Here are links to a collection of photos taken in June in the San Rafael Swell, and some other miscellaneous astronomical photos.

When I show these photos to people, they often ask how to make similar photos themselves. Here’s a summary of what I’ve figured out so far. For much more advice on astrophotography, I highly recommend Jerry Lodriguss’s site.

To photograph the Milky Way, you need the following:
  • A camera. I use Canon’s cheapest digital SLR, the Rebel XS (street price $500). Any other DSLR will probably work fine, except perhaps some of the earliest models which have higher noise levels. There may now be some high-end point-and-shoot cameras that will give acceptable results, but I’m not sure of this; most point-and-shoot cameras can’t take long enough exposures, and even if they could, the noise levels would be unacceptable. Film cameras don’t work well because even the fastest readily available films aren’t as sensitive to dim light as the sensor in a DSLR.
  • A wide-angle lens. I’ve invested in a Sigma 20mm f1.8 lens ($520), although the inexpensive 18-55mm zoom lens that came with my camera was good enough to get started. If money is no object, get the Canon 24mm f1.4 ($1700), along with a full-frame Canon 5D ($2500); that’s what the pros seem to use, as far as I can tell.
  • A tripod. I got a perfectly usable one at a discount store for $29.
  • A dark site. This is the most difficult part for many people. You cannot make decent photos of the Milky Way from a light-polluted city. But here in Utah, there are some very dark sites within a one-hour drive of my urban home. Depending on where you live, you may need to travel farther.
Of course, you also need a clear sky with a view of the Milky Way. From the northern hemisphere, the best views of the Milky Way are in the summer, with the brightest parts in the southern sky.

Before heading out on a dark night, practice with the settings on your camera. Put it in fully manual mode, including manual focus. Set it for a 30-second exposure at ISO 1600, with the lens at its widest aperture (perhaps f3.5 on a zoom lens). Practice turning the display on and off, and turn its brightness down. Set the camera to store images in “raw” format, rather than jpeg. Most importantly, figure out how to manually focus the lens at infinity. Some lenses are conveniently labeled for focusing, but my zoom lens isn’t, so I had to mark the infinity setting (when zoomed out to 18mm) with white tape.

With this preparation, taking the photos should be pretty easy. Turn the display off when you’re pointing the camera (so it doesn’t ruin your eyes’ dark adaptation), then turn it back on to check the settings (30 seconds, ISO 1600, widest aperture) and fire away. It’s hard to compose a photo in the dark, but you can review the composition on the LCD and try again as needed.

After downloading the photos to your computer, use the software that came with the camera to adjust the brightness, contrast, and color balance. With “raw” images you can make some pretty dramatic adjustments without losing quality.

Speaking of quality, there are three factors that limit the amount of detail in a photo of this type:
  1. Digital noise, which gets worse at higher ISO settings;
  2. Lens aberrations, which blur and dim the edges of the image, and which get worse when the lens is opened to a wide aperture (low focal ratio);
  3. The earth’s spinning motion, which turns star images into trails and blurs the Milky Way over time. (In 30 seconds the earth turns by 1/8 of a degree.)
To lessen any one of these problems, you generally need to worsen one of the others. The trick is to make sure that no one of them is much worse than the other two. By all means, experiment with different ISO settings, apertures, and exposure times. I always stop-down my Sigma lens to about f2.8 to reduce aberrations, but stopping-down may not be an option if you’re using a relatively slow zoom lens. I’m happy with ISO 1600, which is the highest setting on my camera. Most of the digital noise disappears when I reduce the photos to screen size, but in long exposures there are always some “hot pixels” which can be manually fixed in Photoshop if necessary.

Even with the most expensive equipment, photos made in this way will not be sharp enough to withstand poster-size enlargements. For example, I’m a big fan of Wally Pacholka’s photos, and I have a framed 36-inch panorama of his in my living room, but it doesn’t show much more detail at that size than in the screen version on his web site.

It’s a nice touch to include foreground scenery in your photos, but if you want more than silhouettes, you’ll need to plan carefully. A small amount of artificial light, from ambient light pollution or even a flashlight, can sometimes illuminate the scenery without ruining the Milky Way. Moonlight is another option, but anything bigger than a crescent moon will brighten the sky too much for a good Milky Way photo, and there are only a few nights each month, and a few hours each of these nights, when the crescent moon is above the horizon after dark. Even then, the moonlight won’t always be shining in the direction you want.


If you don’t want to include foreground scenery in your photos, then life becomes much easier. You can try using a tracking mount to compensate for the earth’s rotation, allowing much longer exposure times. Then you can use a smaller aperture and/or lower ISO setting to reduce problems 1 and 2 above. You can even use a film camera, which is far less expensive but requires additional skills and patience.

Wednesday, June 16, 2010

APOD Celebrates 15 Years


Astronomy Picture of the Day, one of the very best sites on the Web, is celebrating its 15th anniversary today. My heartfelt thanks go to its devoted authors and editors, Robert Nemiroff and Jerry Bonnell--and to NASA for hosting the site.

APOD’s diversity is remarkable. The pictures include straight photographs, highly processed digital images, graphs, and even paintings. They come from professional astronomers, NASA, dedicated amateurs, scientifically inclined artists, and historical archives. The subjects go beyond pure astronomy to include the space program, earth science, and physics. Each picture comes with a short lesson, written by the editors, full of hyperlinks for those who want to learn more.

Although APOD is pitched to the general public, it’s also extremely useful to those of us who teach introductory astronomy, and to any scientist who needs a daily dose of breadth in this era of hyper-specialization.

Among Web sites, APOD is also remarkable for its simplicity: No banners, no sidebars, no drop-down menus, no fancy fonts. This is the Web as it was originally meant to be, where content takes precedence over presentation, and the hyperlinks are inserted by real human beings. The most noticeable change since 1995 is that the pictures have gotten bigger. They’ve also added Javascript rollovers to annotate some photos, and even an occasional video. And there’s now a linked forum where you can discuss the pictures. But simplicity still prevails.

Wednesday, April 28, 2010

Science and Nature Reading List


Now that school’s out, it’s time for summer reading! Here are a dozen of my favorite science and nature books, recommended to students, colleagues, and friends alike. None of them are especially recent, and in fact, many are books that I first read for fun during graduate school, when I should have been working on my thesis. They’re listed below in approximate order by difficulty, starting with the lightest reading and ending with books that require some effort. None, however, assume any specialized background. Of course there are hundreds of other good science and nature books out there, most of which I haven’t read. I can’t promise that you’ll like all of these as much as I do, but I can promise that each of them is of the very highest quality.
  • Encounters with the Archdruid by John McPhee. In this classic from the golden era of environmentalism, McPhee arranges for Sierra Club hero David Brower to spend some quality time with three of his natural enemies: a mining geologist, a resort developer, and a dam builder.
  • Desert Solitaire by Edward Abbey. Essays by a hard-nosed realist about the wonders of southern Utah: juniper trees, snakes, clouds, heat, quicksand, tourists, inhabitants, and the encroachment of industrial civilization.

  • The Cuckoo’s Egg by Cliff Stoll. My favorite mystery, and all true! A Berkeley hippie astronomer and computer geek discovers that a hacker is breaking into U.S. Government computers. Soon he’s teaching the FBI, CIA, and NSA all about internet security.
  • Voodoo Science by Bob Park. An entertaining survey of perpetual motion machines, cold fusion, human space flight, and other things that look like science but aren’t. Written in the same spirit as Martin Gardner’s classic, Fads and Fallacies.
  • Basin and Range by John McPhee. The best geology book ever written, which just happens to be about the place where I now live. Filled with clever juxtapositions of human and geologic time. The three sequels are also good: In Suspect Terrain, Rising From the Plains, and Assembling California.
  • First Light by Richard Preston. Before the author became famous for writing The Hot Zone, he spent some time hanging out at Palomar Observatory and wrote this delightful book about the astronomers working there.
  • 365 Starry Nights by Chet Raymo. Among the hundreds of guides to the night sky, this is by far my favorite. It offers a mini astronomy lesson for each night of the year, with lovingly hand-drawn illustrations. Its only deficiency is the lack of an index, so I created one years ago.
  • The Character of Physical Law by Richard Feynman. A set of seven informal lectures by the great theoretical physicist, just as relevant and insightful today as when they were first delivered in the 1960s. If you like this, you’ll also enjoy Feynman’s QED: The Strange Theory of Light and Matter, which presents four more lectures on quantum physics.

  • Guns, Germs, and Steel by Jared Diamond. The big picture of human history and prehistory.
  • The First Three Minutes by Steven Weinberg. Still the best book on cosmology, written soon after our understanding of the hot early universe became firmly established.
  • The Copernican Revolution by Thomas Kuhn. This well-crafted classic on the history of astronomy reminds us that a moving earth was once just as much a threat to some peoples’ belief systems as evolution and global warming are today.
  • Gödel, Escher, Bach by Douglas Hofstadter. A weighty masterpiece that interweaves art, music, logic, puzzles, puns, language, molecular biology, and artificial intelligence.

Monday, February 15, 2010

Yet Another Planetarium Simulation


Last November, as another semester of teaching Elementary Astronomy drew to a close, I finally broke down and started writing my own planetarium simulation.

On its face, this was a ridiculous waste of time. There are already dozens, if not hundreds, of planetarium simulation programs that will show you where the stars and planets appear in the sky, as viewed from your chosen location at your chosen time. They run on every microcomputer platform and many handheld devices. Some are extremely sophisticated, with databases of millions of stars, beautiful images, and even the ability to interface with a telescope.

But I wanted something a little different. To be useful to most of my students, a simulation program has to be (a) free; (b) delivered through a web browser, with nothing to download or install; (c) easy for beginners to understand; and (d) convenient for showing the motions of the stars and other objects with respect to earth's horizon.

Sky View Cafe is a great Java applet that almost fits the bill, and I’ve been recommending it to my students for several years. It’s loaded with features and was obviously written by a pro. But its time/date control is a bit awkward to use, so it isn’t ideal for showing celestial motions. Worse, its default full-sky view can be disorienting for beginners, who often have trouble relating the circle on the screen to the domed sky overhead.


Fifty-six years ago, H. A. Rey showed the best way to draw the sky for beginning observers. The illustrations in his delightful book Find the Constellations show half the visible sky at a time, as if viewed through a huge domed window stretching 180 degrees from side to side, from the horizon at the bottom to zenith at the top. I vividly remember reading that book as a child, and I wanted a web applet that gives a similar view of the sky.

I also wanted intuitive, analog controls for changing the time and date, so the sky’s motions would be easy to explore. Inspired by the GoSkyWatch iPhone app, I settled on a circular dial for changing the time of day, with a concentric inner dial for changing the date of the year. I added similar analog controls for setting the latitude and longitude.


To make the motions even more apparent, I included a feature that WSU’s digital planetarium projector has: the ability to show “trails” that simulate long-exposure or multiple-exposure photographs. Besides the familiar star trails, you can use this feature to trace out analemmas and retrograde loops.

This project has soaked up much of my free time for the last three months, but I think it’s essentially finished for the time being. I hope my students--and others who discover it--will find it useful.

Wednesday, September 30, 2009

Astrophotography for the Rest of Us


A couple of decades ago, when I was still using a fully manual SLR film camera, I tried some simple astrophotography: Long-exposure photos of star trails from a fixed tripod, and also some “piggyback” photos with the camera mounted on a small motor-driven telescope to track the stars. The results were satisfying but hardly spectacular, and the time required was substantial enough that my priorities soon turned elsewhere.

Then last January, at the start of the International Year of Astronomy, my interest in astrophotography began to return. By then I was using a marvelous little Canon point-and-shoot digital camera, and I was delighted to learn that it would take time exposures as long as 15 seconds. While spending the New Year’s holiday in remote Boulder, Utah (about as far from city lights as you can get in the contiguous 48 states), I decided to brave the cold and try a few shots of the winter constellations.

To my astonishment, that little camera recorded 10 times as many stars as my eye could see. Unfortunately, the photos were also plagued by digital noise that severely limited the aesthetic possibilities. I suppose this noise is the digital equivalent of the grainy appearance of photos on high-speed film.

Meanwhile, I had been marveling at the ever-better scenic night photos posted on NASA’s Astronomy Picture of the Day site. Following the links from some of my favorites, I discovered sites like TWAN and The Sky In Motion. These photographers were using digital SLR cameras to make stunning photos showing the sky in great detail behind interesting foreground scenes. The noise levels were acceptable, because DSLR cameras have bigger and better electronic sensors than my point-and-shoot.

A terrific resource for would-be astrophotographers is Jerry Lodriguss’s web site, Catching the Light. One of his technical articles indicates that even some of the cheapest consumer-model DSLR’s can produce excellent night shots. But did I want to spend even $500 for such a special-purpose toy? “Well,” I rationalized, “I’ve already had two astronomy students use DSLR cameras for their observing projects, and I need to learn how to help them when necessary.”

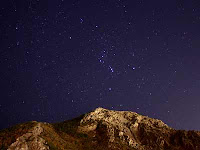
I got the new camera on September 10. Then even I, a professional geek, had to spend a week just getting familiar with all the buttons and menus. I also discovered that to shoot exposures longer than 30 seconds (without a computer connected), I needed to get a $25 remote switch. Finally prepared, I headed up to Ogden’s foothills on a couple of our recent spectacular September nights. The best shots from these sessions are posted here. In short, I'm amazed at what can now be done with amateur equipment and very little effort.

Incidentally, this was the first time I’ve ever been glad for light pollution. Although scattered light from the city brightened the sky (and pretty much ruined any shots facing west), that same light pollution cast beautiful illumination on Ogden’s mountains.

How much further I’ll take this hobby, I have no idea. Certainly I’ll try some photos from a few other sites around Ogden. And I’ll bring the new camera on camping trips, to see what it can do from some darker locations. Perhaps I’ll try to schedule these trips to coincide with favorable moonlight to illuminate the scenery.

But I’m not a professional photographer, so if you want to see really nice photos of the sky, follow the links above.

Monday, July 20, 2009

Apollo 11


I don’t have anything original to say about the Apollo moon landings, but they did influence my life and so this anniversary is an occasion to reflect.

When Neil Armstrong stepped out of the lunar module and onto the moon, I had just turned seven. I barely remember watching the great event on TV, and I’m sure its significance didn’t sink in at the time. My parents were more interested in the other big news of the late 60’s: the Vietnam war, the civil rights movement, political assassinations. My brother and I were more interested in whether the Cardinals would get to the World Series.

But as I got a little older, and the Apollo landings continued, I began to show serious geekish tendencies. I bought and assembled plastic models of spaceships. I checked out all the astronomy books from my grade school library, and learned to identify the stars and constellations. In art class I drew pictures of imagined rockets that would take people to every planet in the Solar System. Eventually I grew up and became a scientist.

The moon landings had little direct impact on science. Sure, we learned more about the moon’s geology, but there were no big surprises. The real impact of the moon landings was cultural. Bob Park said it best:
How can Apollo 11 be described? It was a feat of skill and daring unmatched in history. The Apollo moon landing transcended the struggle between the United States and the Soviet Union for world domination. It was a source of pride and inspiration for the whole human race, symbolizing the heights that humans are capable of reaching and overshadowing every space mission before or since.

The problem with putting on a great show is that everyone expects an encore. Where shall we go next?

And our Solar System offers no good answer to that question. The next nearest world after the moon is a hundred times farther away. That world is Venus, where the CO2 atmosphere has created a run-away greenhouse effect, scorching the surface with temperatures high enough to melt lead--and with an atmospheric pressure that would crush a nuclear submarine. Humans will never walk on Venus.

How about Mars? It’s only a little farther than Venus, and much more hospitable: very little atmosphere, and about as cold as Antarctica. Astronauts in spacesuits would be no worse off there than on the moon. The problem is the distance.

It took three days for the Apollo astronauts to reach the moon. Traveling at the same speed, it would take about a year to reach Mars. Ah, but that was 40 years ago. Surely rocket technology has improved exponentially since then, so we can travel much faster...?  

Actually, no. Rocket technology was already quite mature by 1969, and the laws of physics don’t permit any major, straightforward improvements. Perhaps we could shorten the travel time to a few months, but nobody has any idea how to get to Mars faster than that. We could probably keep a crew alive on such a long flight, but only at tremendous cost.

So human space flight has retreated to low-earth orbit, just above the atmosphere. Since 1972, no human has traveled farther from earth’s surface than Cape Canaveral is from Houston. Most of the scientific research that goes on during these orbital missions is aimed at understanding how the human body deteriorates during long periods of weightlessness.

Besides months of weightlessness, astronauts bound for Mars would be exposed to the serious radiation hazards of interplanetary space. And even if these hazards can be mitigated, the risk in such a journey would be tremendous. If anything goes wrong (think Apollo 13), the chance of a successful bailout is inversely proportional to the distance from earth. A failed mission to Mars would be a tragedy not just for the crew, but for all of humanity.

If the real goal is to inspire our children, I think there are better ways. It’s the robotic spacecraft that do NASA’s scientific work, touring the Solar System and peering at the distant universe from above earth’s obscuring atmosphere. Many of the technologies used by these spacecraft, to see and sense and transmit data, have advanced exponentially since 1969. Instead of watching a fuzzy transmission on TV, today’s children can use the internet to explore the surface of Mars or visualize the patterns in the cosmic background radiation.

Let us therefore celebrate human space flight by giving it a hero’s funeral--and get on with the business of exploring the universe with 21st Century technology.

Sunday, July 5, 2009

iPhone Astronomy


When I gave up my Palm Z-22 for an iPhone in March of last year, one of the few things I sacrificed was a free little astronomy app that would draw a chart of the planets and constellations for any date and time.

Third-party apps for the iPhone became available a few months later, and among the initial offerings were four good astronomy apps. They cost $9 to $12 each, but they were far more powerful than what I’d had before. Over the year since then, two of these apps have been greatly improved and three others have been introduced. The most powerful of them now costs $19, but there are good choices for $5 to $6 and one of the apps also comes in a pretty good free version.

I have no idea whether these apps are stimulating more interest in astronomy among the general public, but I sure hope so. They’re affordable, fun to use, and instantly available whenever you find yourself out under the stars wondering what you’re looking at. Although astronomy software for full-sized computers is more powerful still, it’s often more expensive and harder to use--besides being tied to a large, power-hungry device that you can’t slip into your pocket.

The iPhone (and iPod Touch) user interface is ideally suited for this kind of software. On the screen you see a map of the sky, automatically adjusted for your current location. The amount you see at any one time is limited by the screen’s small size, but you can move the map around and zoom in and out instantly, using intuitive finger gestures. The better apps are so easy to use that even if I’m sitting at my computer, I prefer to pull out my iPhone to look up the time of sunset or the phase of the moon or the best time to view the Andromeda Galaxy.

In a modest effort to promote these apps, I decided last winter to write a review of them. Not a quick off-the-cuff review, but a thorough review of all seven apps, with a detailed comparison table and lots of screen shots. Otherwise, how are users supposed to choose among the seven apps--or even know that they have so many choices? (There’s no easy way to even find them all on the iTunes Store, which outgrew its primitive organizational scheme long ago. Astronomy apps are variously categorized under Education, Navigation, and Reference.)

The review project ended up being a little too ambitious, and I’ve had trouble keeping the review up to date. Still, there are hundreds of people out there who have read the review, and I’m getting a steady trickle of email thanking me for it. If a few more people fall in love with astronomy as a result, it will have been time well spent.

Astronomy is just one of many subjects where computing makes more sense on a mobile device than on a bulky computer. Another is trail maps and nature guides, as I mentioned recently. I get the sense that most of us, including the software developers, are still adjusting to this paradigm shift, and I look forward to the next generation of useful mobile apps.