In an attempt to reduce my
heating bills and carbon footprint, last September I installed an
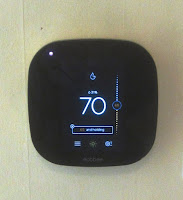
Ecobee 3 smart thermostat.
Now, after using it through a full heating season and analyzing the results, I can report that it accomplished everything I hoped.
Should you buy one too? That depends.
Why the Ecobee?
The idea behind a “smart” thermostat is to gather a whole bunch of data (past temperatures and settings, furnace and AC run times, outdoor weather, and times when you’re home and awake), then use this data to anticipate your heating and cooling needs and to keep you comfortable, automatically, without wasting energy. If you want a thermostat that does this then you can consult any number of
online reviews for advice.
I
don’t want my thermostat to set itself automatically. I’m fully capable of setting it myself, thank you very much, and I stubbornly cling to the notion that I’m still smarter than any thermostat.
But I decided to get a smart thermostat anyway, because I wanted the ability to remotely monitor the temperature in my house over the internet, and to remotely adjust the setting from time to time. Also, I wanted to get my hands on all that data. As usual, I take my mantra from
Mr. Money Mustache:
Measure everything, then get angry at waste!
The most popular smart thermostat is the
Nest, but for my purpose it has a fatal flaw: They don’t let you download the data! You can view some daily summary data over the internet, and they send you monthly summaries by email, but the manufacturer has decided that you’re not even allowed to see the full minute-by-minute temperature and operation data, much less download it.
The Ecobee folks, on the other hand, treat their customers with respect. Through their web interface you can view a detailed chart of what’s happening in your house, and with a few clicks you can download the data as a CSV file for analysis in a spreadsheet or other software.
That feature was enough to earn my business, so I went ahead and ordered an Ecobee, directly from the manufacturer. The price was $249, but I got a $100
rebate from my gas company. Installation was easy, although there can be complications depending on how your existing system is wired. With a couple of taps on the touch screen I configured it for fully manual operation.
My house has no air conditioning, so during the summer I use the Ecobee only as a remote-monitoring and data-logging device. It does, of course, use some electricity to accomplish these things: about 7 watts of continuous power, which adds up to 60 kilowatt-hours (about $6 worth here in Utah) of electrical energy per year. It also requires a continuously operating internet connection and wifi router.
One unique feature of the Ecobee 3 is that it comes with a wireless, battery-powered external sensor that you can use to monitor the temperature in another room, away from the thermostat. Their advertising suggests that this is almost as good as being able to heat different parts of your house independently, but of course that’s not the case; you merely have the flexibility to
control the heat based on the temperature at one or another location. I put the external sensor in my basement laundry room, so I could make sure the pipes wouldn’t freeze when I was away during the winter. (Being a data junkie, I eventually purchased two more external sensors, for another $79, so I could also monitor the temperature in my living room and bedroom.)
How I cut my gas use by 35% [see update below]
As it turned out, that external sensor in the basement is what saved me the most money. I was away from home quite a bit during the winter of 2015-16, and at those times I aggressively set the thermostat down, letting the temperature drop to 48 F upstairs and 40 F in the basement. Without the sensor next to the water pipes, and the ability to remotely monitor it and make adjustments if needed, I never would have taken the risk of turning the thermostat so low.
To put my savings in perspective, here’s a plot of my annual natural gas use ever since I bought my house in 1998:
The total for 2015-16 was 18.4 decatherms (MBtu), or 35% less than my average use from 2004 through 2015. When you consider that some of that (about 4 decatherms, I think) is for my hot water heater, the reduction is even more impressive. Gas is cheap here in Utah—about $8 per decatherm—so I saved only about $80 over the season, and it’ll take another year before the thermostat nominally pays for itself. On the other hand, not all of the reduction was a direct effect of the smart thermostat: my motivation to save energy was probably at an all-time high, and it’s possible that the winter was a little warmer than average [see update below].
Getting the detailed data
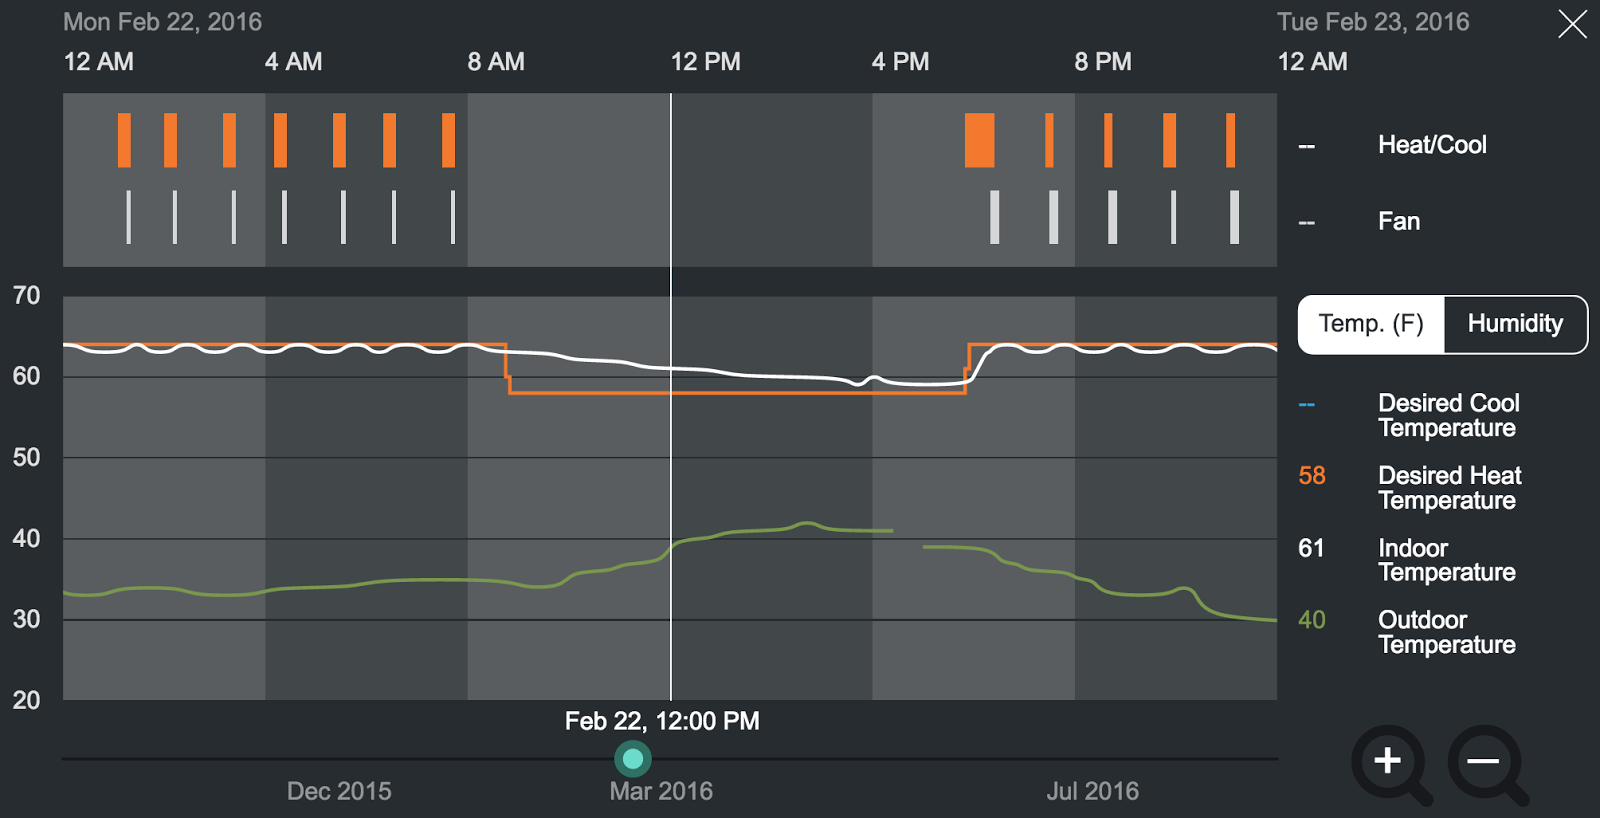
And what about the detailed thermostat data? Here, to start with, is a screen capture showing what you can view through the Ecobee web interface:
The orange graph is the thermostat setting; the white graph is the temperature at the thermostat; the green graph is the outdoor temperature (obtained from public weather data for my local area, so it’s not literally the temperature right outside my house); and the orange bands at the top show when the furnace was running. On this particular day I kept the thermostat at 64 degrees when I was home, but set it down to 58 when I was at work. The furnace cycled on and off seven times between midnight and 8 am, didn’t run at all while I was away, ran for more than a half hour to warm the house up when I returned, and then cycled on and off four more times before midnight.
This web interface to the data is a wonderful thing, but I find it a little clunky and hope they’ll make some improvements in the future. Although you can scroll through the entire time period since your thermostat was installed, you can’t zoom out to view more than 24 hours of data at a time. Updating the graph with new incoming data requires multiple clicks and a delay of about 10 seconds. The graph always omits the most recent hour or so, and it won’t show the separate data from all your sensors, even though you can view all the current readings on a different web page.
To get a more comprehensive picture you need to download the data and plot it up yourself. Fortunately, the download process is easy and fast. As I mentioned above, you get a CSV file that you can open in a spreadsheet. The file contains a row for every five-minute time interval, and each row contains 20 or more data fields: date, time, thermostat settings, heating/AC/fan activity, outdoor temperature and wind speed, and, for the thermostat itself and each external sensor, the temperature and whether the motion detector was activated. You can download up to a month’s worth of data (more than 8000 rows) at a time.
The ways of plotting up all this data are endless. Here, for example, is a plot of my temperature data for the month of July. Can you guess which week I was out of town?
Thermal properties of my house
One of my goals in obtaining all this data was to measure the thermal properties of my house. To do this I focused on the six-month heating season from November through April, and selected eight-hour-long periods at night (to avoid solar heating) when either the furnace was holding the indoor temperature steady, or the furnace didn’t run at all. (I didn’t use data from nights when neither of these conditions was met for eight consecutive hours.)
Working with the steady-temperature data, I used the furnace running time to calculate the rate at which the furnace had to supply heat to the house, to maintain the steady temperature. To calculate the heat rate I had to know that the furnace is rated to use 75,000 Btu per hour, at an efficiency of 92%; I’ve checked the Btu/hr value by reading my gas meter, but I have no good way to check the efficiency. Here is a plot showing the heating rate as a function of the average temperature difference between inside and outside:

You can immediately see from this plot that my 75,000 Btu/hr furnace (69,000 Btu/hr when you factor in the 92% efficiency) is much more powerful than necessary. Even on the coldest nights it needed to put out only about 14,000 Btu/hr to maintain a steady indoor temperature, so it was running only about one fifth of the time. Extrapolating, I conclude that my furnace could maintain a steady indoor temperature even if the outdoor temperature were as much as 200 degrees lower than indoors! How’s that for over-engineering?
A linear fit to the plotted data gives a slope of approximately 344 Btu per hour per degree Fahrenheit, meaning that for each additional degree in the temperature difference, the furnace had to supply additional heat at a rate of 344 Btu/hr. Of course that heat must also be escaping from the house (through the walls, windows, ceiling, and foundation) at the same rate, because the indoor temperature wasn’t changing. The value 344 Btu/hr/°F is therefore what is called the thermal
conductance of the exterior envelope of my house.
There’s quite a bit of scatter in the data, so this measured conductance is somewhat uncertain. The standard error in the best-fit slope is only 6.4%, but when I plot subsets of the data (chosen by time of year or thermostat setting) I get a much wider range of values, so I would put the uncertainty very roughly at 20%.
You can also see from the plot that a best-fit line does not go through the origin; in fact the vertical intercept is at −2800 Btu/hr, with a rather large uncertainty (perhaps 40%). This means that on a typical winter night, heat from some other source must be entering my house at a rate of roughly 2800 Btu/hr, or about 800 watts. Some of that is from the refrigerator, electric blanket, and human bodies, but after slicing and dicing the data I’m convinced that there’s also a contribution from underground heat coming in through the basement floor and foundation.
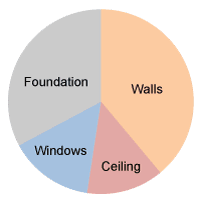
In principle, you can calculate the thermal conductance of a house without making any temperature measurements at all. You just need to know the sizes and thermal conductivities (R values) of the components of the exterior envelope. Add the R values for each layer of a given component (e.g., plaster, wood, brick, and air films for my uninsulated walls), then divide this total R value into the surface area to get that component’s contribution to the conductance. I had never before done this calculation for my house, because there’s a lot of guess-work involved and I had no good way to check the answer. But now I have done the calculation, and amazingly, I obtained a total conductance of 374 Btu/hr/°F, within ten percent of the measured value! The pie chart shows a breakdown of how each major component of my house’s envelope contributes to this calculated total.
The ceiling contribution is small because it’s the only place where my 81-year-old house has at least a little bit of insulation. Of course, these fractional contributions could still be pretty inaccurate. But I now have enough confidence in my calculations to start considering whether I should try to add insulation to my exterior walls and foundation.
By the way, people sometimes say that homeowners should focus on air infiltration as a major source of heat loss. That may be true for some homes, but I’ve always been skeptical in my own case. My calculations justify this skepticism because I was able to account for
more than 100% of my house’s measured heat loss through conductance estimates alone, completely ignoring infiltration.
Meanwhile, as mentioned above, I’ve also looked at data from winter nights when the furnace didn’t run at all—so the indoor temperature dropped steadily. Here is a plot of the rate of temperature decrease as a function of the average temperature difference between inside and outside:

The slope of this graph is minus the thermal conductance divided by the effective heat capacity of the interior of my house. (So a high thermal conductance makes the graph steeper, because heat escapes faster, while a high heat capacity makes it shallower, because there’s more energy that needs to escape in order for the temperature to drop by a given amount.) The best-fit slope is −0.023 degrees per hour, per degree (or simply inverse hours if you prefer). Dividing this into the previously measured conductance of 344 Btu/hr/°F gives a heat capacity of approximately 15,000 Btu/°F. That’s equivalent to the heat capacity of 15,000 pints of water, or 1800 gallons, or enough to fill my bathtub up to the brim 26 times. So filling the bathtub wouldn’t make much of a dent in the total heat capacity!
An alternative way to estimate the heat capacity is simply to measure how long it takes the furnace to warm the house up after adjusting the thermostat upward. For example, on one winter evening it took my furnace two hours to warm the house by 14 degrees Fahrenheit. The furnace supplied 138,000 Btu of heat over that time, so the estimated heat capacity would be (138,000 Btu)/(14°F) = 10,000 Btu/°F. The effective heat capacity is smaller over this relatively short time period, because less of the house is actually being warmed up by the full amount.
In principle I could try to calculate a theoretical heat capacity, by adding up all the contributions of the materials and contents of my house. It would be interesting to know roughly what percentage comes from wood, plaster, concrete, and so on. But making reasonably accurate estimates would be quite a bit of work, so I’ll put that off to another day.
The more useful thing to know is that even on a very cold night (bottom-right corner of the graph), my house cools down at a rate of less than a degree Fahrenheit per hour. This means that setting the thermostat down for, say, eight hours at a time saves only a small amount of energy, because the
average indoor temperature over that time will be no more than two or three degrees lower. This average drop is what matters, because it determines how much less heat the house loses to the outdoors—and therefore how much less heat the furnace must replace. Any further energy savings from not running the furnace during this time will be offset when you run it to heat the house back up afterwards. (You can see all this vividly in the screen-capture image above.)
So how did I save huge amounts of energy, cutting my gas bill by 35%? Partly by setting the thermostat somewhat lower even when I was home, but mostly by setting it way down when I was away for 24 hours at a time or longer. If your house is never unoccupied for more than half a day at a time, then you shouldn’t expect dramatic winter energy savings from a smart thermostat. Summer might be another matter if you use air conditioning, but I wouldn’t know. And if you own a vacation home that’s unoccupied for half the winter, then install a smart thermostat in it immediately!
Update, July 2019
Honesty compels me to report that over the last three years I’ve failed to keep my gas use as low as it was during 2015-16. Here is an updated chart:
Over these last three years my annual gas use has averaged 23.6 decatherms, which is only 16% less (not 35% less!) than the average from 2004 through 2015 (before I installed the Ecobee thermostat). The most recent winter was the coldest of these three, so I’m not too worried about a continuing upward trend in gas use as the chart might suggest. Instead I think I’ve reached a new normal, after the anomalous one-time low during 2015-16.
The direct carbon emissions from burning 23.6 decatherms of natural gas come to 1.25 metric tons (2760 pounds), so this contribution to my personal carbon footprint is somewhat larger than any one of the contributions from
electricity use,
driving, or
flying.